
Mapping Methodology
The following text was developed from a series of blog posts by Peter Rauxloh of Museum of London Archaeology (MOLA). For the original texts see: Recreating Rocque, London 1746; Fitting Rocque to Modern London: Georeferencing; Fitting Rocque to Modern London: Investigating the Warp Factor; Populating Rocque: What Was There; and Rocque Map Gets New Identities.
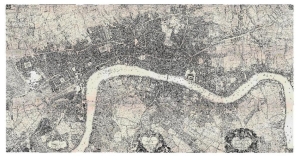 Rocque 1746, Prior to Georeferencing.
Introduction
To create a version of John Rocque's 1746 map of London that could be used to accurately illustrate the distribution of data drawn from other sources, Museum of London Archaeology (MOLA) first had to create a single page version of the original map. This map was then warped onto the first reliable Ordinance Survey map, from 1869-1880, creating a direct georeferenced relationship between the first accurate modern representation of London and Rocque’s eighteenth-century version. Building on the existing street and place index created by Patrick Mannix, together with newly digitised administrative boundaries of parishes and wards in the City of London, Westminster, Middlesex and Surrey, an enhanced index of places was then generated using a GIS based spatial-join methodology. The technique yielded separate polygons (and from these, centroids) for each combination of place and parish, place and ward etc. that can be identified. This enables historical data sets identified to a place and parish for example, to be plotted with greater accuracy and analysed statistically. The precise methodology and processes involved have been detailed below.
Creating a Single Map
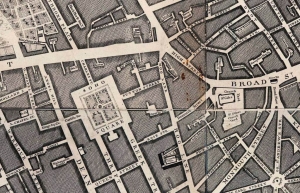 An illustration of the poor registration achieved through an
automated process.
In order to create a version of Rocque's map that could be used as the basis for this web resource, it had to be transformed from a collection of 24 separate maps into a single image. This is more difficult than it would at first sight appear. The sheets were not printed from a single connected drawing which was then ‘cut up’ to fit the published format(c.50 x 70 cm), but instead were printed from 24 separate plates. And while the underlying survey was executed as a connected representation of the area, each printed sheet started as a draft drawing of only a part of that area (roughly 1.1 x 1.3 km in size). These separate images were then overlain on waxed metal sheets (normally copper), and the lines traced by hand downward into the wax. The image of the map traced in this way was then engraved onto the underlying copper plate, and titles impressed onto the plate with a punch. Ink was then placed in the incised lines and letters, damp paper overlain, and pressure applied, allowing the paper to absorb the ink to create an image. The sheets were then left to dry, shrinking and varying their shape somewhat in the process.
The task of working with these original images was initially carried out in Adobe Photoshop. Each sheet existed as a TIF file, and was processed individually to correct for variations in sheet height and width caused by differential shrinkage, and variation in precisely where on the sheet the printed image appeared. Each scan was trimmed to the edges of the actual cartography (as opposed to the engraved edge reference numbers and marks) and the trimmed widths were noted.
The trimmed scans were then placed in their correct relative position. At first, we experimented with using a GIS-based raster registration technique of the sort commonly used to display adjacent raster scans as a continuous layer, as in for example ordnance survey 1;10,000 mapping tiles, but quickly discovered that problems of differential paper shrinkage made this approach untenable. In the end, a manual method of edge matching was used instead. This involved the careful hand placement of each sheet with its neighbour and comparing the quality of fit. Where a general scale error was observed, minute magnification factors were applied in the relevant plane to line up the map images as closely as possible. On occasion a whole sheet was minutely revolved to agree with adjacent sheets Any remaining sliver apparent at the map joins was graphically filled. These final errors were perhaps the best illustration of the effect of differential shrinkage within a sheet, since they demonstrated that the loss of width between the top and bottom edges of a sheet was not linear.
Overall the scale factors applied were between 98.4 and 100.6%, and no rotation was greater than 1 degree. To put this in proportion to the real world, this meant that a sheet’s distortion may have caused it to lose up to 0.48m or gain up to 1.6m on the ground. The map was produced at a scale of 26” to the statute mile which is roughly 1:2500. This means that a 0.5 mm width on the original map, (the typical width used for road edges) represent 1250 mm or 1.25m on the ground. The adjustments made are therefore on the cusp of what can be depicted at this scale, yet without them the mismatch was obvious and intrusive.
Fitting Rocque to modern London – Georeferencing
Having created a single map from the 24 original sheets, the resulting image then needed to be 'georeferenced'. Georeferencing is the process by which an electronic image of the earth is located on to the earth in the right place, so that the features it depicts overlie the same features shown on a current measured reality. At the start of the process the image’s dimensions are purely graphical ones, measured in pixels i.e. the number cells it has across and down. At the end of the process those same pixels have a geographic coordinate value and represent a certain distance on the ground. When done correctly, the process allows the features shown on one image to overlay the same features on another map to which it is referenced.
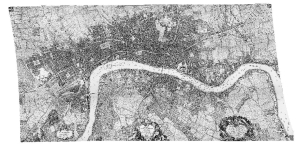 Rocque 1746 After Georeferencing.
However, georeferencing an historic map creates two distinct problems. First, identifying pairs of long-lived common points on both the historic map and that produced 200 years later is difficult. And second, the optical ground survey that created the old map, had to contend with both systematic error such as poor instrument adjustment or a stretched measuring chain, and a panoply of non-linear sporadic sources of gross and minor error which can occur during the survey itself as well as during the creation of the representation of the survey on paper. The inconsistent errors present in an historic map will typically require it to be warped in order to fit to the modern measured reality. Thus the orthogonal scan of an historic map plate will typically have a distinctly irregular, warped shape after it has been georeferenced. This stretching and 'warping' is evident in the georeferenced version of Rocque available on Locating London's Past.
The georeferencing operation carried out for this project involved identifying some 48 common points between Rocque's original map, and a modern OS map. As each pair of points was added to the set, the computer provided an average measure of disagreement between them, allowing us in turn to reject those pairs which greatly increased this value. When georeferencing the Rocque map greater levels of agreement were achieved when making use of the junctions of road centrelines as the common points rather than the corners of notable buildings. The latter are a common and useful target for georeferencing since buildings like churches tend to endure. However the basic technique Rocque employed for his map, were angular and distance measurements made at street level with theodolite and chain, and the detail of buildings that lined those roads were more sketchy. In the funding proposal Rocque and his engraver John Pine made for the map, they note that its scale of 200 feet to the inch would allow:
A depicted scale of 1 inch to 200 feet, means that a pen width on the printed map of 1mm equates to c.2.4m on the ground. Churches were engraved with a 1mm line or greater and very little error in initial measurement or final engraving would result in edges wobbling by twice or even three times this amount. Street centre lines on the other hand, have the inherent accuracy of the long sight-lines that created them, and while the edges remain subject to the same degree of wobble in Rocque's depiction as buildings, their centres should be more robust. It is important to remember however there will always be some level of error during a georeferencing operation and indeed when surveying in general. Allowing for that error is important in pursuing good practise.
Once a set of points had been chosen, the scanned Rocque map was then transformed, with the effect of substantially stretching the map in the upper left and lower right hand corners. In small part, this 'distortion' grew out of differential shrinkage of the paper on which the individual map plates were printed, as described above. However the error in the Rocque map that caused it to be so clearly warped in order to fit the geographical reality, have a wholly different source, and one that reflects significantly on the state of surveying practise in the Britain at the start of the 18th Century.2
Fitting Rocque to modern London – Investigating the warp factor
England’s first national mapping agency – the Ordnance Survey – was founded in 1791, almost 50 years after the creation of Rocque’s central London map. The first notable act of the OS was to carefully measure a baseline in Hounslow, West London, so that it could form the first part of a control network of survey points that would eventually cover the nation. This network of survey points provided the basis of every single map the OS produced of the British Isles until the advent of global positioning systems in the late 20th century. The definition and measurement of the baseline was undertaken with the utmost care over two and half months, with glass rods – unaffected by variations in temperature – being used to measure the distance itself, and the termini of the baseline being marked by carefully sinking de-commissioned cannon.
The procedure needed to be this precise because the national survey was to be implemented using a method known as triangulation, and the success or failure of a triangulation process rests on the accuracy with which its initial baseline is measured.
A triangulation (literally the making of triangles) begins with the measurement of a baseline, and once this is established an instrument able to record horizontal angles is placed at the start of the line(A). Another instrument is placed within sight at the other end(B). Then a point off the base line whose location is unknown is identified(C), and the angle to it from the base line is recorded. Next the instrument is moved to the other end of the base line (B), the start of the line sighted (A) and the same unknown distant point is sighted (C). With these two angles the measured distance of the baseline, and some trigonometry, you can calculate the lengths of the lines AC and BC and thereby the location of the unknown point. From these three known points, the same process can be repeated to coordinate further unknown points, which themselves become part of the network. For example measuring the angle from BC, to a new point D etc.
Apart from the obvious benefit of being able to determine the location of points without visiting them, what makes the technique so strong and its discussion here relevant, is that within this network of triangles it is possible to re-measure or re-check the location of a point by viewing it from different points to those used for its initial coordination. In this way it is possible to calculate multiple possible values for a point’s location, and from these repeated measures, generate an average value. Since the differences in the measurements will be normally distributed (most values will be roughly the same but a few will be more and a few less) this process allows the amount of agreement or degree of error in the readings to be clearly identified, and for values significant distant from the mean to be rejected.
The technique was first applied in the mid 16th Century, and was used to great effect by various members of the Cassini family in their ground-breaking survey of France, as well as smaller surveys in Britain and elsewhere. But by the start of the 18th century it had yet to be applied to the survey of a large metropolis. Rocque’s decision to utilise the technique to provide a check on the measurements made at street level, is recorded in his account of the map’s creation in a version published in 1747. In his words, the creation of the map was aided by;
An image hidden in the margin of one of a latter map shows the intrepid surveyor – probably Rocque himself – balanced on a ‘remarkable building’ and presumably aiming the theodolite at another equally notable structure.
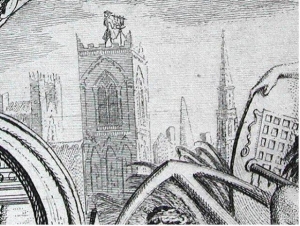 Detail from John Rocque’s Map of London and Ten Miles Around’
started in 1744.
The application of these two fundamental survey tools by Rocque – repeated measures and independent checks – resulted in a notable false start. When distances calculated at street level with chain and theodolite, were found to contain major errors when compared with the same measurements calculated from the triangulation, he simply had to start the whole enterprise again.3 Moreover, the application of triangulation to tighten-up the survey’s accuracy may explain the warping we see in the georeferenced map.
One could ponder how thorough Rocque was in his observations; how many times each angle was measured, how powerful was the instrument, what sort of instrument calibration regime was followed and how did he accurately set up over an observation point? Indeed we could consider if the contemporary account of the lauded Jonathan Sissons theodolite Rocque used, as ‘..the best, most complete, handsome, and well designed instrument possible’ was actually true. Yet the most salient point here, is that if one is to use triangulation to check the accuracy of ground measurements, there has to exist suitable vantage points to use for the exercise. Church towers made the best observation point, and for the area covered by the 1746 Rocque map approximately 62% of the parishes shown where within or directly adjacent to the City walls. Since each parish would typically have a single church within it, this would be a rich hunting ground for the tower-hungry triangulator. Beyond this area, however, lay the other 48%, and more saliently the parishes in the ‘neighbouring country’ as Rocque termed it, which were on average 20 times larger than those in the centre of the metropolis. Thus, outside the core, there are fewer larger parishes, meaning fewer and poorer opportunities for triangulation measurements.
This lack of notable buildings outside the historic core would have greatly impeded the extension of Rocque’s triangulated checks to the South and East of the City particularly. It is therefore likely that more of the measured information in these areas would have been captured solely by chain and theodolite which we know from the survey’s false-start, were more likely produce gross errors. It is in just these peripheral and distant areas, that the warping effect is most marked and the quality of fit to the underlying geography least accurate.
Populating Rocque – What was where?
Processing Rocque's map essentially produced two datasets; a single georeferenced image of the 1746 map that had originally been published as 24 separate sheets, and a set of points to indicate the location of all the named streets and places and the parish and ward in which they were located. This latter point data provides a valuable resource for other researchers of the period, because it allows data gathered by street and parish – tax returns, average age of death, quantity of beer consumed etc. – to be plotted on a map. In short the project has created a resource whereby researchers can more easily engage with the significance of space and location.
The creation of this new data set, built on an existing index of the 1746 map,4 which identified some 6000 streets, areas, (yards, squares etc.), churches and other notable buildings. This existing index provided coordinates for each point expressed as a pixel location within a single sheet – i.e. the number of pixels across and down from the scan’s top left hand corner. The challenge for this project was to transform these pixel co-ordinates on a map image, in to geographical ones related to the earth's surface.
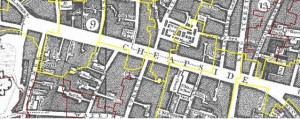 Parish boundaries which intersect with the street of
Cheapside, London.
This existing data set also had to be extended such that there was a separate point for each combination of the spatial criteria we were using, (Ward, Parish and Street). Thus whereas the existing index had single point for the centre of a street, our aim was, for instance, to have 4 points for that street because it passes through four different parishes. For example, the street of Cheapside in central London is some c.500m long and traverses seven separate parishes.
Thus the new data set or index had to under go two processes; the georeferencing of the existing point data and the extension of that dataset into the more comprehensive state state that recognised the divisions of parish, ward and county. For both of these processes the first question was which map base ought to be used to locate these datasets: the georeferenced Rocque map, or the more accurate 1st/2nd edition OS data that came out some 150 years later? Since the project aimed both to embed Rocque's eighteenth-century map within a geographical reality, and also to create a dataset that could be re-used to process and link to earlier and later maps, it made sense to choose the more precise and accurate map - the nineteenth-century OS map.
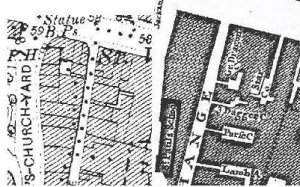 Comparison of area around north Cheapside on 1st edition and
Rocque maps.
Processing the existing index of places
The existing index recorded the details of places on a per sheet basis, each of which needed to be transformed. To do this, we carried out a two point transformation, on each of the 24 original sheets of the map, as 24 separate operations. This had the benefit of limiting errors to a single sheet. While point location would still degrade with distance from the pairs of points used in the transformation, on a sheet-by-sheet basis that distance and consequent degradation was less pronounced than it would have on a transformation undertaken on the whole map.
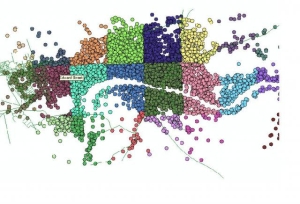 Points plotted from existing index of places following,
georeferenced on a per-sheet basis.
However it is important to note that even this operation was not expected to drop one of the existing points into precisely the correct spot as shown on the existing Old Bailey Online map tiles.
Extending the data set
Moving from a simple index to an extended data series proved a time consuming process, since it required that all thoroughfares present in 1746 be mapped, and the entire street network be identified street by street. Returning to the example of Cheapside, our aim was to create 8 separate points for each parish this street traverses, and to do this we needed to start with a polygon which would represent that thoroughfare. This would allow us apply a geoprocessing operation whereby polygons representing parishes would be intersected with the polygon representing Cheapside to produce 8 new baby polygons whose centre could then be calculated.
Expansion of the place dataset began with the digitisation of a connected network of street lines from the ordnance survey maps, to include all routes shown on the Rocque map. Lines were traced along routes and ‘snapped’5 at one or both ends to another line in the network.
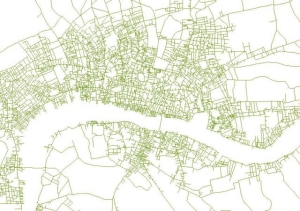 Completed street network for main area covered by Rocque's
map..
The street network defined a single line data set for each street, but two other details were also recorded. The first was an average width of the street, the second a type category of the route precedence within a hierarchy. There were 7 levels of thoroughfare defined.
1. Main thoroughfare – outsized e.g. Holborn, Cheapside -
typically 20m width. This code is also to be used for those
roads that run around squares and similar entities.
2. Main thoroughfare – standard width (c.15m)
3. Secondary thoroughfare – standard width (c.10m)
4. Tertiary thoroughfare – standard width (c.6m)
5. Alley way – i.e. a narrow route running between two
streets or street and place polygon (1-2m)
6. Cul-de-sac plus area – i.e. a dead end but one which
opens out into a court. The wider area is captured as a
polygon and will be amalgamated with class 6 streets
(typically 1-2m but up to 10 for a Mews)
7.
Cul-de-sac – i.e. a simple dead-end. (1-2m but up to 10 for a
Mews)
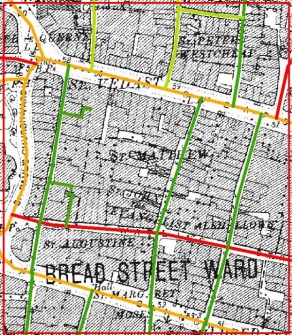 Detail of street network showing colour graded street
classifications..
This was accompanied by the creation of a polygon layer that recorded all the areas (squares, notable buildings, yards etc.) which were shown on Rocque, including on occasion, portions of streets where there was a short but marked increase in width. These polygons were classed as either standalone (e.g. a churchyard or notable building) or connected, i.e. a wider area too which a narrower thoroughfare led, for example a yard.
The Holborn Viaduct dilemma
As described above, the street network and place polygons were digitised from the 1st and 2nd OS mapping, with the warped Rocque map acting as a guide as to which roads to digitise (since there were many more roads by the late 19th century). However the reverse was also true - the Rocque map often shows details which had been obliterated by later developments. A good example of this is the re-working of the area around Holborn viaduct. In such cases we worked from the Rocque map itself. Aware of the degree of warping that this map exhibited following its georeferencing, a leaf was taken out the method adopted for the processing of the existing place point index, and individual, focussed georeferencing operations were performed.
This began by delineating with a temporary polygon of a problem area – like Holborn viaduct – as requiring special attention. Then the rough area on the warped Rocque map was accessed. At this point the map was georeferenced again, but solely using common points around the area of change which yielded an improved fit between it and the OS data in just that area. The quality of fit outside that area was irrelevant.
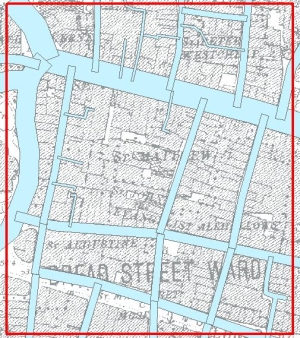 Street lines expanded to polygons based on recorded
width.
These width and street-rank measures of the roads were recorded so that two further GIS operation could be performed on the data. The first used the width to create a polygon from the centre line of each street to which any connected polygons could be amalgamated. The street rank, was then used to determine which polygon ought to be trimmed by another so that any overlapping was minimised. Where streets of the same rank joined (as shown in the top left of the image ) no trimming took place.
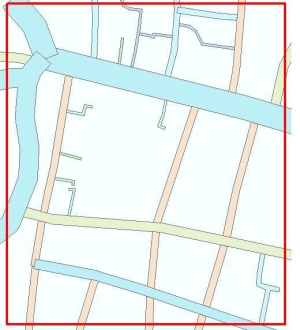 Street polygons trimmed on the basis of the hierarchy of
routes.
The reason these buffer and trim operations took place was to yield a clean set of polygons that could then be intersected with the parish and ward polygons also being prepared. Having streets represented as polygons, as opposed to lines, enabled us to generate both a more accurate centroid for each street and parish overlap, but more importantly it enabled us to see many of them in the first place. In 1746 and indeed today both ecclesiastical and administrative boundaries will often follow a street centreline; if streets were only represented using lines, we would miss the fact that one half of a street is in one parish and the other is in a different one.6
A final point here is that as discussed at the outset, the ultimate purpose of the operation was to enable the creation of an accurate point data set. The street centrelines, buffered out to a standard width, do not, and were not meant to trace the fine edge of the actual street edge as shown on the OS or Rocque maps; rather they are an approximation to those edges. This was both an expedient approach to achieve the desired goal, but more pragmatically the 1 inch to 200 foot scale adopted by Rocque was simply too coarse to capture such edge detail. Even with perfect accuracy, at this scale wobbles in the street edge of less than 2.4 meters could not really be shown.
Footnotes
1 Hyde, R 2003 'Portraying London Mid-Century – John Rocque and the Brothers Buck' in London 1753, S O'Connell Ed pp28-38 ⇑
2 A detailed blow by blow account of the subject is given in Rachel Hewit’s excellent and readable publication Map of a Nation: A biography of the Ordnance Survey (London: Granta Books, 2010). ⇑
3 Unpublished research paper Jonathan Sisson and London’s 18th century mathematical instrument trade, Alex Werner, Museum of London. ⇑
4 Originally created by Patrick Manix of Motco Limited ⇑
5 GIS shorthand for the operation whereby one piece of vector data is connected to another, i.e. there is no chance of having a miss-match. ⇑
6 This focus on boundary accuracy was another reason why the digital capture programme had to take place using the OS rather than the georeferenced Rocque mapping. ⇑
